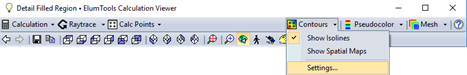

The Contours button in the Calculation Viewer controls the display of Isolines and Spatial Maps with the calculated results. In its simplest form, this button serves as a toggle to switch on and off the visibility of previously configured Isolines and/or Spatial Maps from Settings. By default, when first selected in a new rendering, it will toggle on Isolines using Smart Colors and Scheme 1 (below).
|
Once changes have been made in Settings, the button will toggle on and off your custom settings when selected. The custom settings are per instance of the calculation viewer.
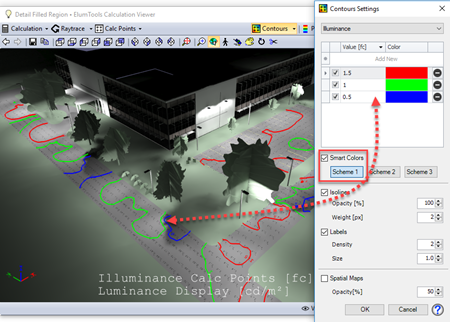
Smart Colors The Smart Colors checkbox is enabled by default. This features will typically create 3 to 5 isoline values based on the maximum and minimum values calculated in the scene. These values will serve as range boundaries for the spatial map shading.
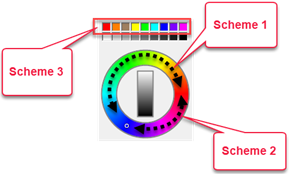
Scheme 1 - Follows the longest path around the color wheel from the min color to the max color interpolating the intermediate colors for the other isolines. This produces the broadest range of colors.
Scheme 2 - Follows the shortest path around the color wheel from min color to the max color. This will produce a more narrow color gradient. |
Scheme 3 - Uses fixed standard colors from the color dialog and will sometimes look identical to Scheme 1.
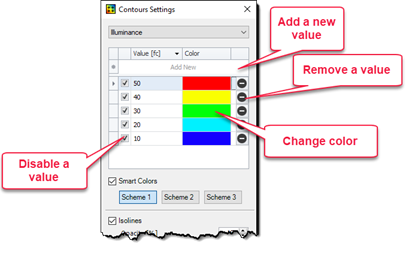
Controlling Values and Colors
Aside from the use of Smart Colors and the intelligent values selected by ElumTools, it is easy to establish your own custom values and colors.
|
|
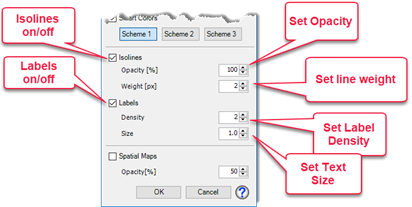
Isoline Properties
You can control the individual properties of Opacity, Weight (line), Density and Size (of text) from the dialog.
|
|
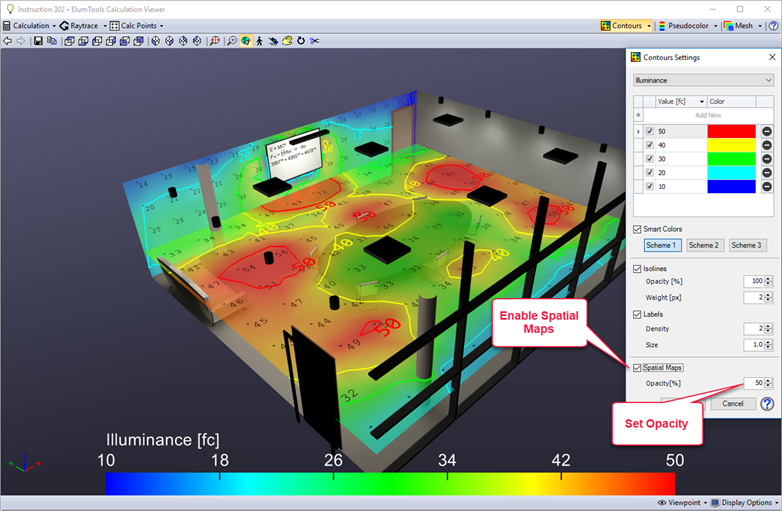
Spatial Maps
Spatial Maps utilize the colors and values specified in the upper portion of the dialog as ranges for a linear shaded gradient representation of the lighting coverage. This is an excellent and intuitive graphical representation of lighting coverage that your clients will appreciate. Spatial Maps can be enabled at the same time as Isolines for maximum impact.
The default Opacity value for spatial maps is 50%. This allows maps on workplanes to allow visibility of geometry underneath the map and provides a nice visual cue that the results are not on the floor or at grade.
IMPORTANT! Spatial maps can be enabled in your Revit views (unlike Isolines) using the View Results command. However, when displayed alongside other grids of calculation points (multiple Rooms or Spaces for example), the entire view MUST have the same color scale. This is a restriction of the Autodesk Analysis Visualization Framework (AVF) used by ElumTools to display this information. Revit will assign the composite maximum value as the ceiling and composite minimum value as the base of the color scale. This may cause some areas to appear drastically different than the scaling you have set in the ElumTools calculation viewer.
ElumTools copyright 2018 Lighting Analysts, Inc.